
EstontincPublished 3 min read
Why is my app slow? How profiling finds the real cause before you pay for a bigger server
Slow apps are often caused by a small piece of wasteful code, not a small server. How profiling works, what Cloudflare found with its new Workers profiler, and a checklist before you scale up.

Why is my app slow? When a product starts to feel sluggish or crash, the usual reaction is to pay for a bigger server. Often the real cause is much smaller: one function doing duplicate work, or old code still running in the background. Profiling is how you find it. On 9 October 2026, Cloudflare launched on-demand CPU and memory profiling for Workers and Durable Objects, taken directly in production.
This article explains what profiling is, what Cloudflare found when it used the new tool on its own services, and a practical way to find performance problems in any app.
What is profiling?
A profiler records where an application spends its time and memory while it runs. Cloudflare puts it simply: logs and aggregate metrics only get you so far, while CPU or memory profiling can show you the exact function where your application is using CPU or allocating memory.
The result is usually shown as a flamegraph. Each rectangle is a function call, and its width shows how much CPU time or memory that function uses. The widest boxes are where to look first.
What Cloudflare launched
- CPU and memory profiles for Workers and Durable Objects, requested on demand from the Observability tab in the dashboard or through the CLI.
- Production data. The profile is taken from a Worker serving real traffic, because, as Cloudflare notes, the best way to understand your application is to profile it in production.
- Interactive flamegraphs you can explore in the dashboard, plus a downloadable profile file for deeper analysis.
- Durable Objects by name, so a specific object can be profiled wherever it is running.
One limitation is worth knowing: a Worker needs enough traffic to be profiled successfully, since the profiler observes real execution instead of starting a new instance.
What profiling found at Cloudflare
Cloudflare shared two real examples from its own teams:
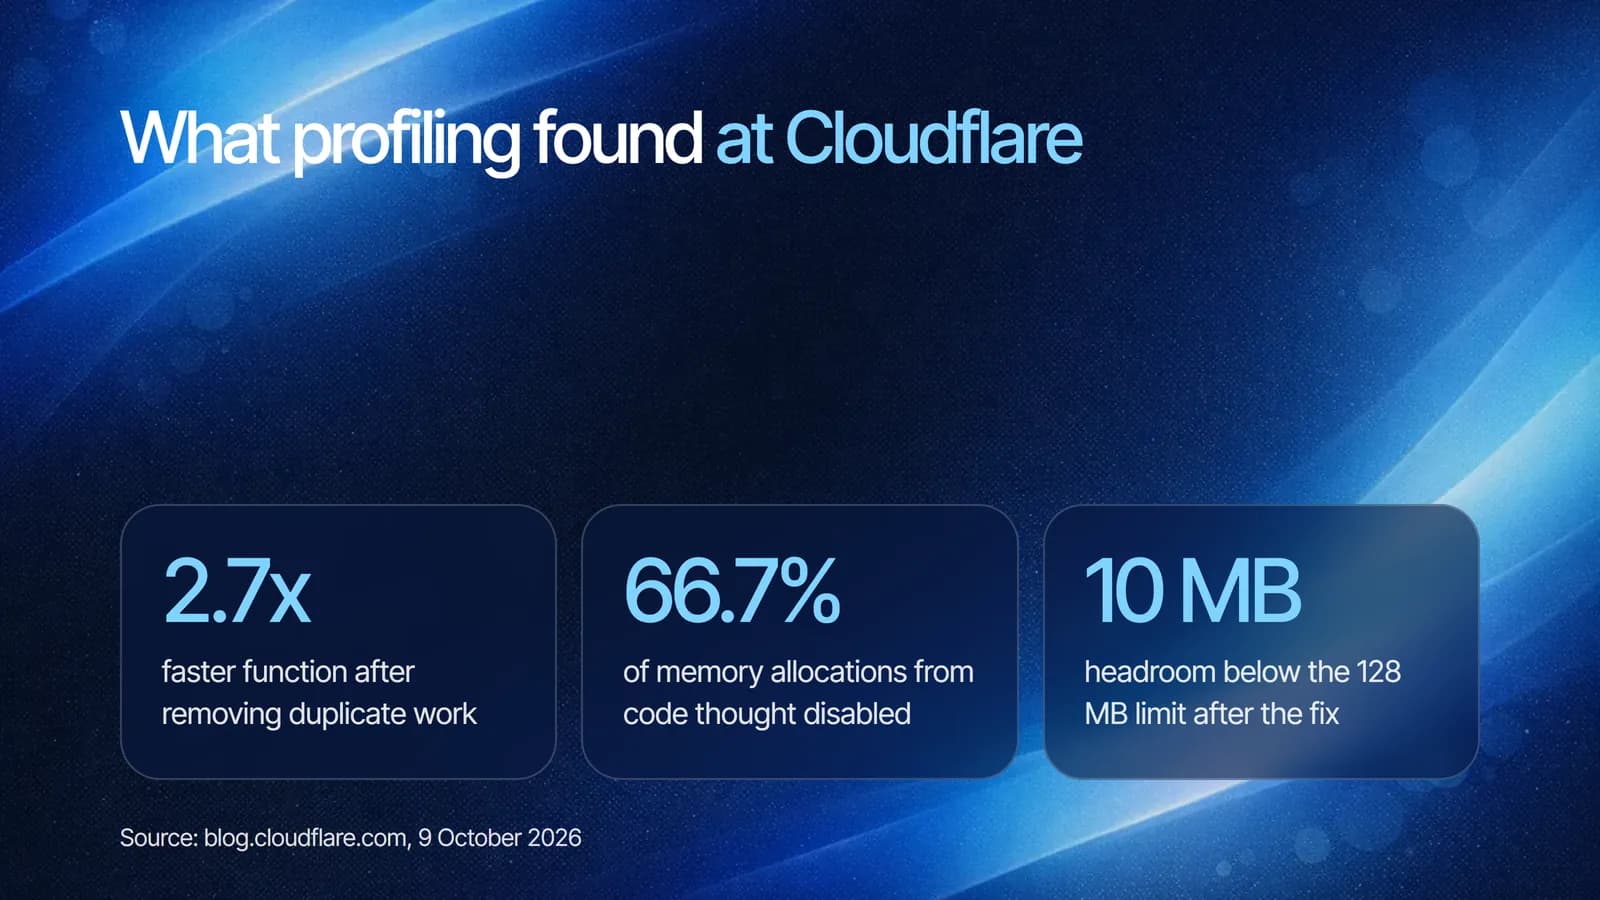
- Duplicate work. In the Worker behind its R2 storage binding, a JSON helper function was walking the same data tree repeatedly. Removing the duplicate work made that function 2.7x faster.
- A hidden memory problem. Another Worker kept failing with “Exceeded Memory” errors, with P999 memory around 133 MB against a 128 MB limit. A heap profile showed that monitoring code thought to be disabled accounted for roughly 66.7% of allocations. Removing it left about 10 MB of headroom below the limit.
Neither problem would have been solved by a bigger server. Both were found in minutes once someone looked at a profile.
How to find the real cause of a slow app
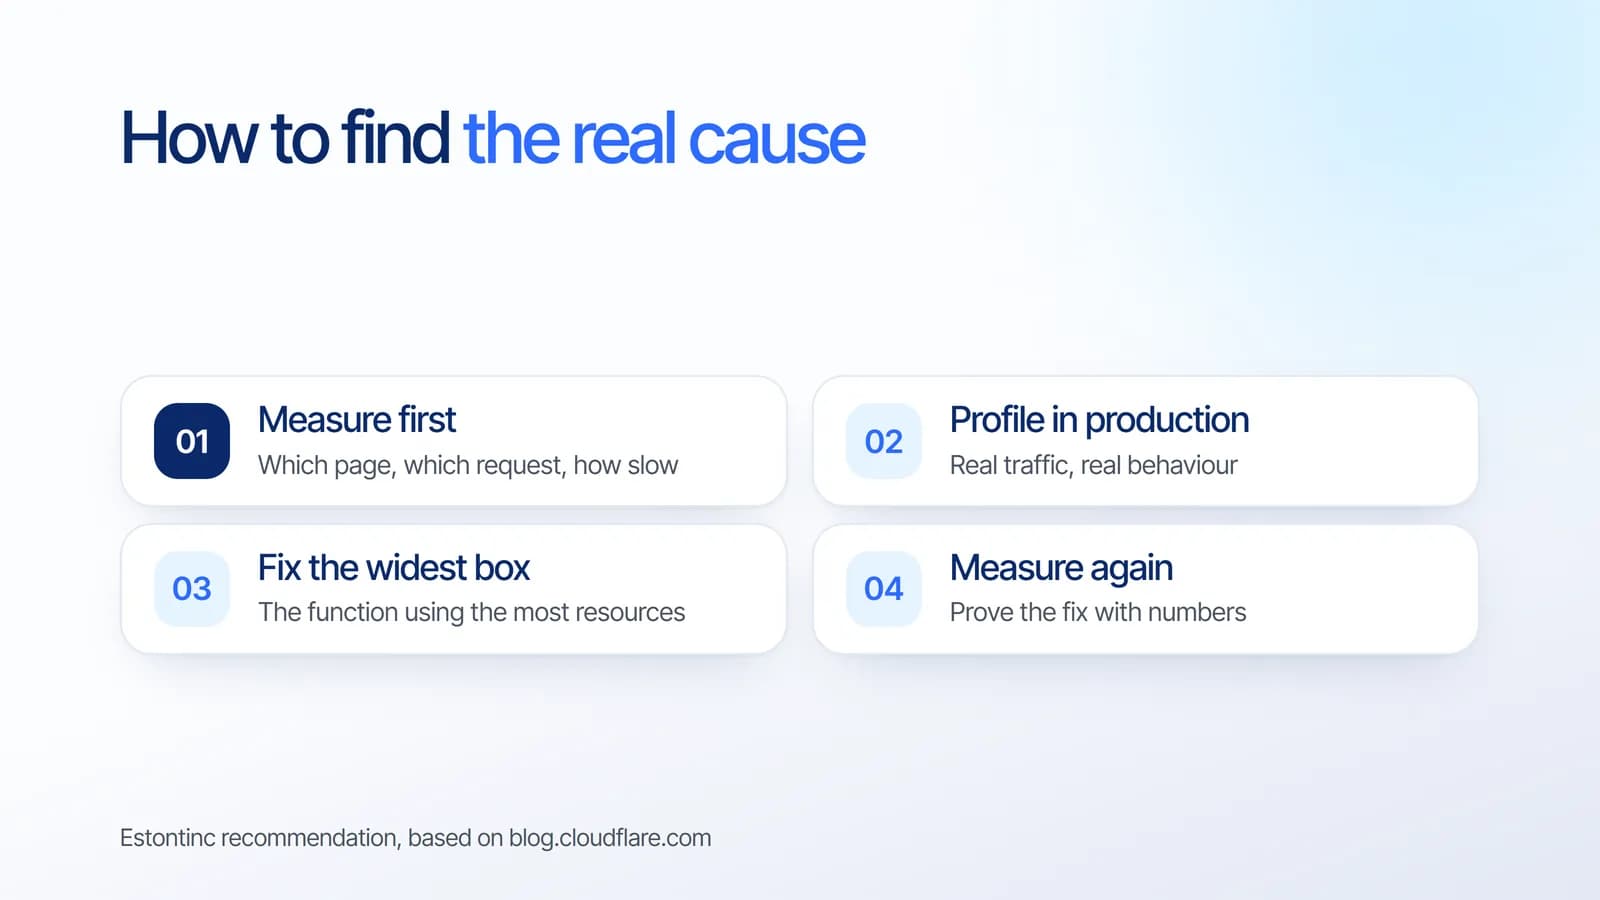
Based on our project experience, this is the order we work in, whatever the platform:
- Measure first. Which page or request is slow, for whom, and how slow? Without numbers, every fix is a guess.
- Profile in production where possible, because real traffic behaves differently from a test machine.
- Fix the widest box. Start with the function using the most CPU or memory, not the one that looks suspicious.
- Measure again and keep the before and after numbers, so you know the fix worked.
Checklist before you buy a bigger server
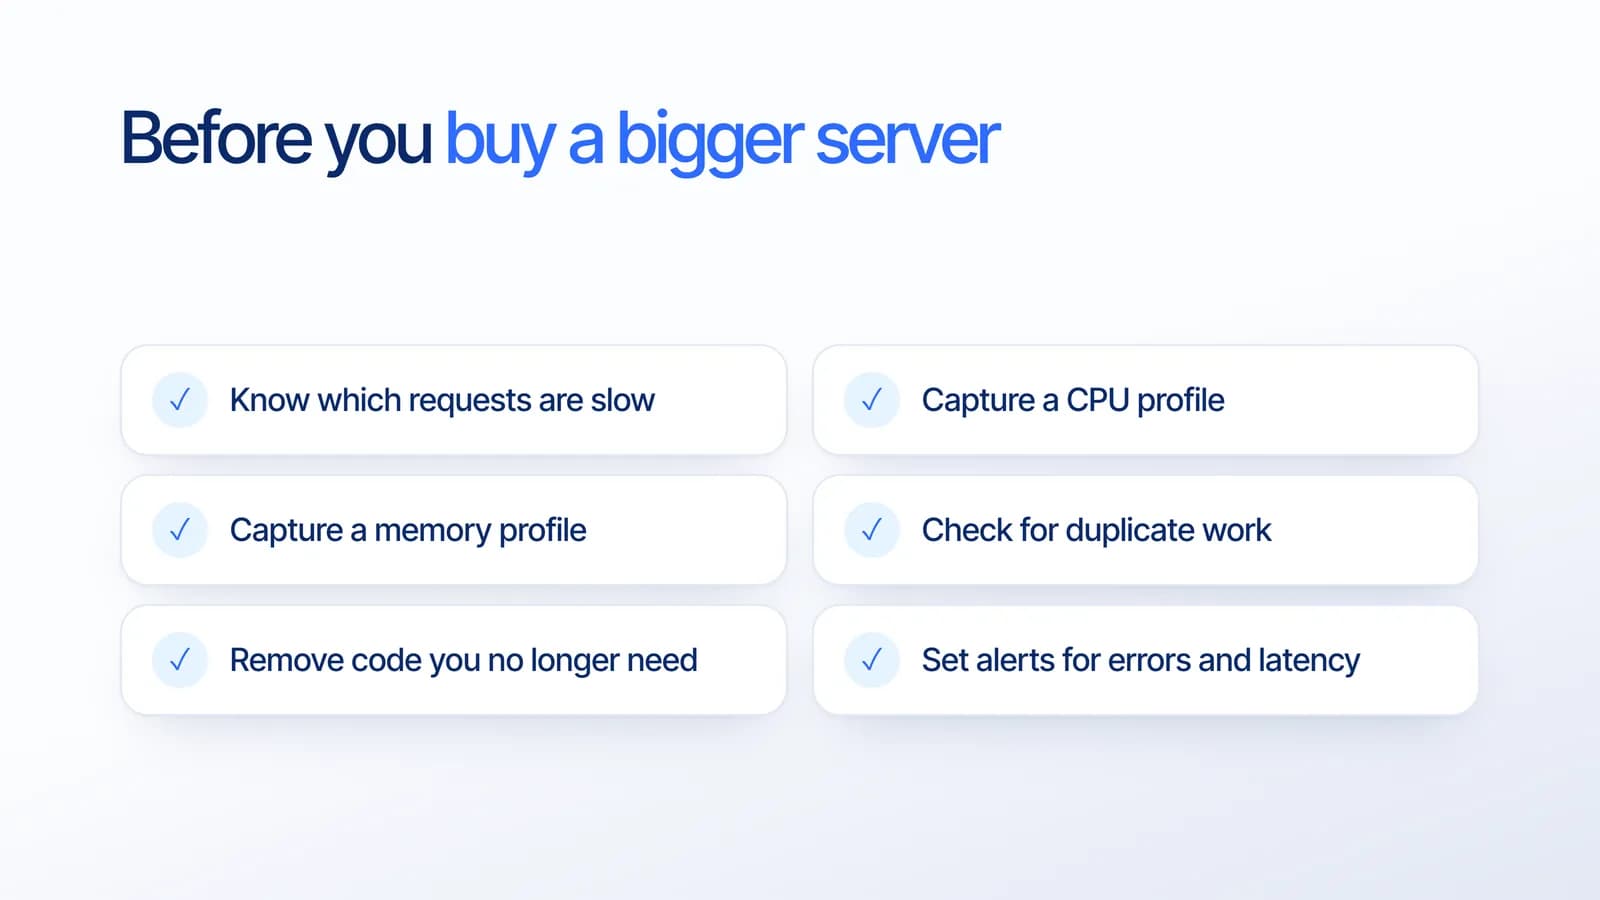
- Know which requests are slow and how often they happen.
- Capture a CPU profile to see where processing time goes.
- Capture a memory profile if you see crashes or memory errors.
- Check for duplicate work, such as the same calculation or call made twice.
- Remove code you no longer need, including features that are only partly switched off.
- Set alerts for errors and latency, so the next problem is caught before users notice.
If you are moving an app to Cloudflare Workers, our article on leaving Deno Deploy covers a safe migration. Shipping fixes in small, reviewed steps also makes performance work easier to measure.
What it means for your business
A slow app costs you customers, and a bigger server costs you money every month. Profiling often turns a vague complaint into one specific line of code. We suggest making performance checks part of regular maintenance, not something you do only after users complain.
How Estontinc helps
Estontinc is a software house in Malang with 100+ projects and 50+ clients over more than six years. Our cloud and DevOps team sets up monitoring, alerts and profiling, and through our web development service we fix the code behind slow or unstable apps, with before and after numbers.
Our maintenance service includes bug fixes, monitoring and backups, so performance stays in check after launch. Tell us where your app feels slow through the contact page, and we will reply within 24 hours.
Frequently asked questions
Why is my app slow?
Common causes include a function doing more work than it needs to, repeated calls to the same expensive operation, memory used by code you thought was switched off, and slow database or network requests. Profiling shows which function uses the most CPU or memory, so you can fix the real cause instead of guessing.
What is a flamegraph?
A flamegraph is a visual summary of a profile. Each rectangle represents a function call, and its width shows how much CPU time or memory that function uses. The widest rectangles are usually the best place to start looking for performance problems.
What did Cloudflare launch on 9 October 2026?
Cloudflare launched on-demand CPU and memory profiling for Workers and Durable Objects. You can request a profile of an active Worker from the Observability tab or the CLI, inspect it as an interactive flamegraph, and download the profile for further analysis.
Should I upgrade my server if my app is slow?
Measure and profile first. In Cloudflare’s own examples, problems were caused by duplicate work and leftover code, not a lack of resources. A bigger server can hide the symptom for a while, but fixing the code usually solves the problem and lowers running costs.
Sources
Facts and figures in this article come from these official sources.
- Cloud & DevOps
- Web development
- Cloudflare
- Performance